One in 12 homes in California are at high risk of burning

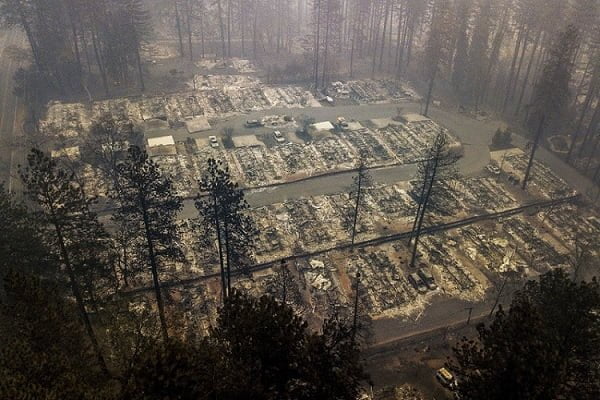
In this Thursday, Nov. 15, 2018, file photo, residences leveled by the wildfire line a neighborhood in Paradise, Calif. More than 2.7 million Californians live in areas that are at very high risk for wildfires. One in 12 homes in California are at high risk of burning in a wildfire. The more information we can share about where and how we’re falling short, the quicker we can come together on potential solutions. (AP Photo/Noah Berger, File)
By PHILLIP REESE The Sacramento Bee
SACRAMENTO, California (AP) — These California communities could be the next Paradise . Is yours one of them?
A lot of Californians live in places that could be quickly destroyed by wildfire. To estimate how many, McClatchy used two primary sources: The U.S. Census Bureau and Cal Fire maps showing “very high fire hazard severity zones.”
The analysis used block-level data from the 2010 Census. Blocks are the smallest level of census geography. McClatchy calculated the center point of each block in the state then calculated how many of those points fell within very high fire hazard severity zones . Finally, McClatchy matched up blocks in very high hazard safety zones with census files showing the boundaries of each city and unincorporated town in the state. We focused our reporting on places where more than 90 percent of the population lived in a very high fire hazard severity zone.
Caveats:
— A small number of places have changed their boundaries since 2010. Any such changes would not be reflected in this data.
— There is more likely to be discrepancies between census blocks and very high hazard fire zones in sparsely-populated places, where blocks tend to cover a larger geographic area.
— Total population figures for cities and census-designated places were calculated using block-level data and may differ from official 2010 Census counts. In most instances, these differences are very small – less than a 1 percent discrepancy between block-level estimates and census figures for the city.
— While conducting the analysis, McClatchy and the AP noticed that a few very high hazard zones on federal land were not properly mapped in a file provided by Cal Fire. These areas, largely parts of military bases in San Diego, were not included in the analysis.
— Notably, this analysis does not reflect population changes across the state since 2010. California’s population has grown about 6% since 2010 and some cities, towns and census-designated places have grown more than others. Updated block level data will not be available until after Census 2020. The numbers provided are most likely an undercount of the current situation.
___
California knows how to protect homes from fires. Why did most Paradise homes burn?
To figure out which homes tended to survive the Camp Fire, McClatchy used damage assessment maps and data from Cal Fire showing homes in the path of the fire.
Cal Fire’s damage assessment included all homes in the Camp Fire perimeter and homes within 100 meters of the perimeter — close enough for embers to spark a new fire . The maps and data also included a field called “YEARBUILT” for each structure, drawn from county parcel data. We segregated the data into two categories: Homes built during or after 2008, when stricter building codes went into effect, and homes built before 2008, ultimately finding that homes built recently suffered less damage than homes built before that date.
Caveats:
— Some parcels contained more than one home. For these homes, the year built is the date when the primary residence was built. For mobile home parks with several mobile homes, the year built is likely when the entire park was built. As a test, McClatchy ran the data excluding lots with more than one home and found results similar to the ones laid out in this story.
— The assessment did not list a construction date for about 250 traditional homes and another 250 mobile homes. Those homes are not included in this analysis.
— About 60 of the roughly 4,100 mobile homes in the path of the Camp Fire were listed as built in 2008 or later.
— The Butte County Assessor’s Office notes on its website displaying parcel data that “the information provided here is deemed reliable, but is not guaranteed.”
All contents © copyright 2019 The Associated Press. All rights reserved.


