An Analysis of California NFIRS Data, 2009‑2011

United States Fire Administration
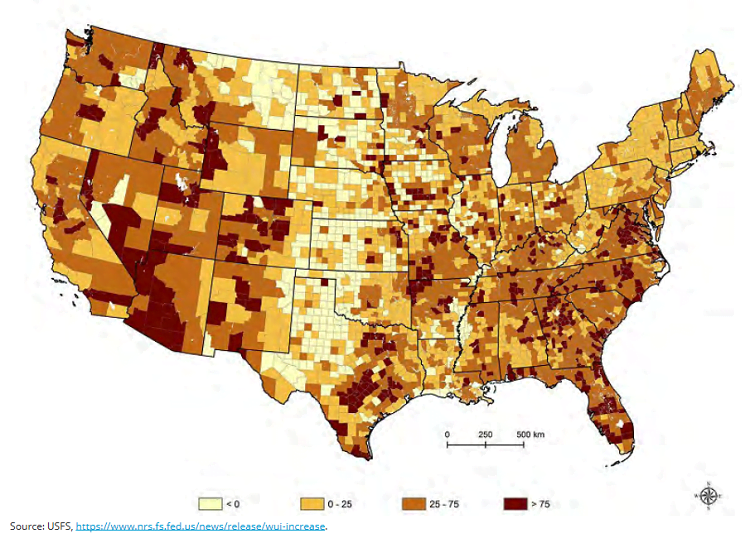
The WUI is the area where housing and natural vegetation meet or intermingle. In the coterminous United States, between 1990 and 2010, the size of the WUI increased by 33% to 770,000 km2 (190.3 million acres), and the number of homes in the WUI increased by 41% to 43.4 million. WUI areas may be the subject of increased attention due to the challenges posed by wildfires and because of recent increases in the number of structures destroyed, area burned and estimated damages annually by wildland fire.
Using NFIRS data, this report examines the fire incidents in WUI areas in California in terms of travel time, loss measures and fire cause for the years 2009 to 2011 and compares those incidents to those outside WUI areas. California was chosen as the methodology test set as it experiences high levels of both wildfires and fires in the WUI, especially in recent years.
Study Goals
The goals of the study were twofold: first, to develop a method to identify fires in the WUI, and second, once identified, to use NFIRS fire data to identify substantive differences, if any, between WUI and non-WUI areas to better understand how the risk from fire in the WUI may be mitigated. It is important to note that the WUI is a geographic area; a fire in the WUI can be any type of fire and not necessarily related to a wildfire or wildland fire. The analysis examines all types of fire incidents, including, but not limited to, wildland fires. Some of the conclusions drawn about fires in WUI areas may shape recommendations for how to mitigate the risk from fire in the WUI.
NFIRS-reported losses in the California WUI are substantial. California averages almost $154.6 million per year in building and structure losses in WUI areas. Mobile structure fires, such as mobile homes, in the WUI incur an additional $3 million per year in property damage; vehicle fire incidents in WUI areas add $19.4 million per year.
Analysis Showed:
- Overall, travel times are higher in WUI areas than in urban areas. Median travel times are 20% to 40% higher depending on the incident type, and mean travel times are 24% to 53% longer.
- Increased travel times may have an impact on the losses in WUI areas, which are generally higher on a per-incident basis than in urban areas.
- Fire cause in WUI areas is more likely to be heating, cooking, appliances and open flame than in urban areas for building/non-building structures and mobile structures. Interestingly, among fires confined to their noncombustible container, heating is more likely to be the cause of fire in WUI areas than in either urban or rural areas. While more analysis is needed, this may suggest that heating fires in WUI areas are more likely to breach their noncombustible container while awaiting a fire department response.
- Although the data examined did not include a large number of exposure fires (fires caused by another fire), an exposure fire in the WUI area is twice as likely to have been sparked by a vegetation fire than in urban areas. Exposure fires sparked by vegetation fires are also twice as common in rural areas as urban areas.


